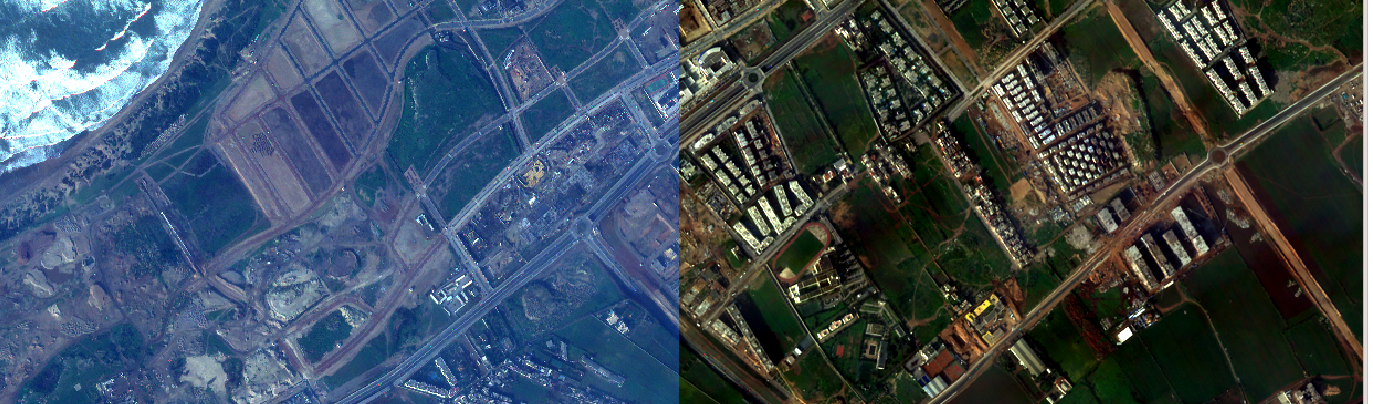
Surface reflectance (L2A)
Product Status
Please be aware that L2A processing level is currently an experimental product still in active production. While we are proud of the results, you may encounter minor inconsistencies as we continue to calibrate our algorithms for global scale. Your feedback during this phase is invaluable as we move toward a finalized version.
If you have technical questions, require specific documentation, or wish to provide feedback on the performance of these L2A products, please reach out to your Account Manager, who will be happy to provide the necessary support.
Product description
L2A is a geometrically corrected, orthorectified product, with atmospheric correction applied to provide bottom of atmosphere surface reflectance values in 4 bands. Pixel values are scaled to surface reflectance (0 to 1) multiplied by a factor 10000 (1e4) to avoid float numbers. L2A has a resolution of 1m for Mark IV and 0.7m for Mark V, the same as L1D TOA.
Atmospheric correction method
1. Core Methodology
The processing pipeline utilizes the 6SV2.1 radiative transfer code1 (Second Simulation of the Satellite Signal in the Solar Spectrum) implemented via the Py6S interface2. This model provides a rigorous simulation of the solar radiation path, allowing us to convert Top-of-Atmosphere (TOA) data into accurate Bottom-of-Atmosphere (BOA) surface reflectance by accounting for:
- Gas Absorption: Removing the effects of Ozone (\(O_3\)) and Water Vapor (\(H_2O\)).
- Aerosol Scattering: Correcting for particles in the air that diffuse light.
2. Atmospheric Data Sourcing & Hierarchy
Inputs are sourced from VIIRS (Visible Infrared Imaging Radiometer Suite) products, adhering to Landsat Collection 2 standards3. We use a hierarchical logic to ensure the best available data is used for every capture.
| Variable | Primary Source (Priority 1) | Secondary Source (Fallback) | Default Value |
|---|---|---|---|
| Ozone (\(O_3\)) | NOAA-20 CMG (VJ104ANC) |
Suomi-NPP (VNP04ANC) |
6S Built-in Models |
| Water Vapor (\(H_2O\)) | NOAA-20 CMG (VJ104ANC) |
Suomi-NPP (VNP04ANC) |
6S Built-in Models |
| Aerosol (AOD) | NOAA-20 Level-2 (AERDB_L2_VIIRS_NOAA20) |
Suomi-NPP (AERDB_L2_VIIRS_SNPP) |
0.226 |
3. Spatial Assignment Logic
To maintain data integrity across different geographies, variables are assigned using the following multi-step logic:
Step 1: Capture-Level Validation
The system first scans the entire footprint of the capture. If valid atmospheric values are entirely missing for a variable, the Default Values (see table above) are applied to the whole capture.
Step 2: Tile-Level Extraction
If valid data is found at the capture level, we refine the data for each tile:
- Averaging: If multiple VIIRS pixels intersect a tile, we use their mean.
- Flagging: Tiles with no valid data intersection are marked for the gap-filling phase.
Step 3: Gap-Filling Strategy
Gaps are resolved based on the percentage of data loss:
- High Data Loss (> 60% of tiles): Gaps are filled with the mean value of all available data from that specific capture.
- Low Data Loss (< 60% of tiles): We apply a spatial interpolation algorithm to estimate missing values based on neighboring tiles.
4. Surface Reflectance Calculation
The conversion from TOA to BOA for each tile is performed using a polynomial inference method:
- Sampling: Calculate the \(5^{th}, 25^{th}, 50^{th}, 75^{th},\) and \(95^{th}\) percentiles of the TOA reflectance for each band.
- Simulation: Run the 6S radiative transfer code for these five specific points.
- Curve Fitting: Fit a 3rd-order polynomial to the resulting TOA–BOA reflectance pairs.
- Inference: Apply this polynomial to every pixel in the tile to derive the final surface reflectance.
5. Metadata Traceability
Each tile is delivered with a BOA_metadata.json file. This ensures every pixel's correction is traceable, documenting:
- Values: The specific atmospheric variables used.
- Source: The exact VIIRS product utilized.
- Method: Whether the data was Directly sourced, Interpolated, or set as a Default.
6. Known Limitations
- Radiometric Continuity: Because correction is calculated per tile, users may observe mild color jumps at tile boundaries.
Tiles
 The L2A tiles are available on the Archive STAC API. Each STAC item is a \(2~\)km by \(2~\)km square tile (plus \(1-1.5~\) meters extra in each direction).
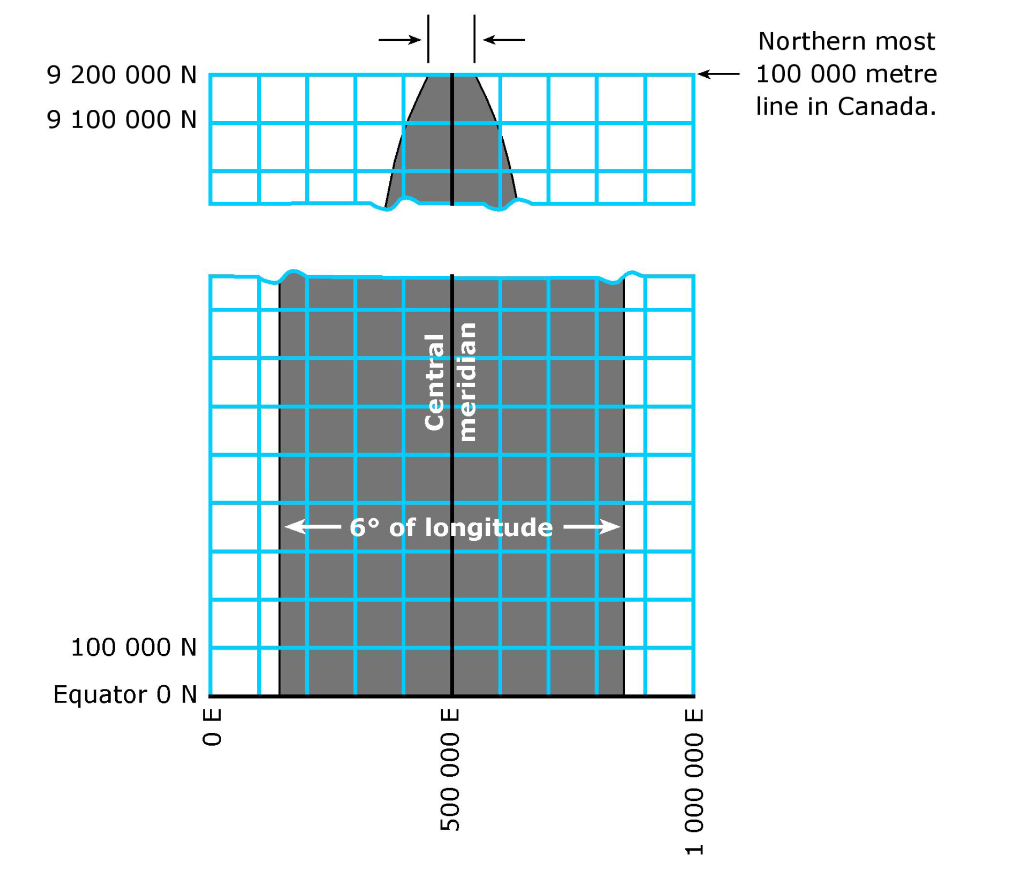
They are aligned to a fixed discrete grid, aligned to the prime meridian of each UTM zone (coordinate \(500000~m\)). Each tile has a designated grid code included in the property grid:code as follows:
SATL-<GRID SIZE>-<UTM ZONE>_ <X>_<Y>,
where X and Y correspond to the easting and northing coordinates of the bottom left corner of the tile.
For example the grid:code SATL-2KM-10N_298_2062 should be interpreted as:
- SATL grid of \(2~km\) by \(2~km\)
- On UTM zone 10N
- With the left bottom corner at \(298,000~m\) easting and \(2062,000~m\) northing.
The tiles have an overlap ranging from \(2-3~\) meters with neighbouring tiles in the grid.
Technical Specifications
| Parameter | Mark IV |
Mark V |
|---|---|---|
| Spectral bands | Blue : 450 - 510 nm |
Blue : 450 - 517 nm |
| GSD | 1 m |
0.7 m |
| Scene Swath | 5.1 km1 |
6.5 km1 |
| Image bit depth | 16 bit |
|
| Max Off-Nadir angle | ± 25 deg |
|
| Algorithms applied | Atmospheric correction |
|
| Geolocation Accuracy | 10m CE90. Varies with the availability of GCPs and cloud coverage2 |
|
| Band alignment | <= 2px |
|
| Image format | GeoTiff, LZW lossless compression |
|
| Ancillary files | Cloud mask (GeoTiff), preview (PNG), thumbnail (PNG), BOA metadata (JSON) and imagery footprint in vector format. |
|
\(^1\) Varies with the altitude of the satellites and the off-nadir angle.
\(^2\) Varies with terrain and only applicable for terrains with rich features.
STAC item
Assets
Non documented files or parameters should be ignored.
All assets follow the same basename template.
{DATE}_{TIME}_{SECOND_DECIMALS}_{SATELLITE}_{PRODUCT}_{PAYLOAD}_{VERSION}_{SUFFIX}.{EXTENSION}
- DATE: Year(4 digits)month(2 digits)day(2 digits)
- TIME: Hour(2 digits)minute(2 digits)second(2 digits)
- SECOND_DECIMALS: All the decimal part from the timestamp seconds
- SATELLITE: Satellite number
- PRODUCT: L2A
- PAYLOAD: MS for multispectral (4 bands)
- VERSION: Check Changelog. Only present in the metadata asset.
- SUFFIX: depends on the asset, can be empty.
- EXTENSION: depends on the asset type.
All time values refer to the capture time in UTC. Hence the string 20220619_153346_938represent actually 2022-06-19 15:33:46.938.
Raster, preview and thumbnail

Cloud
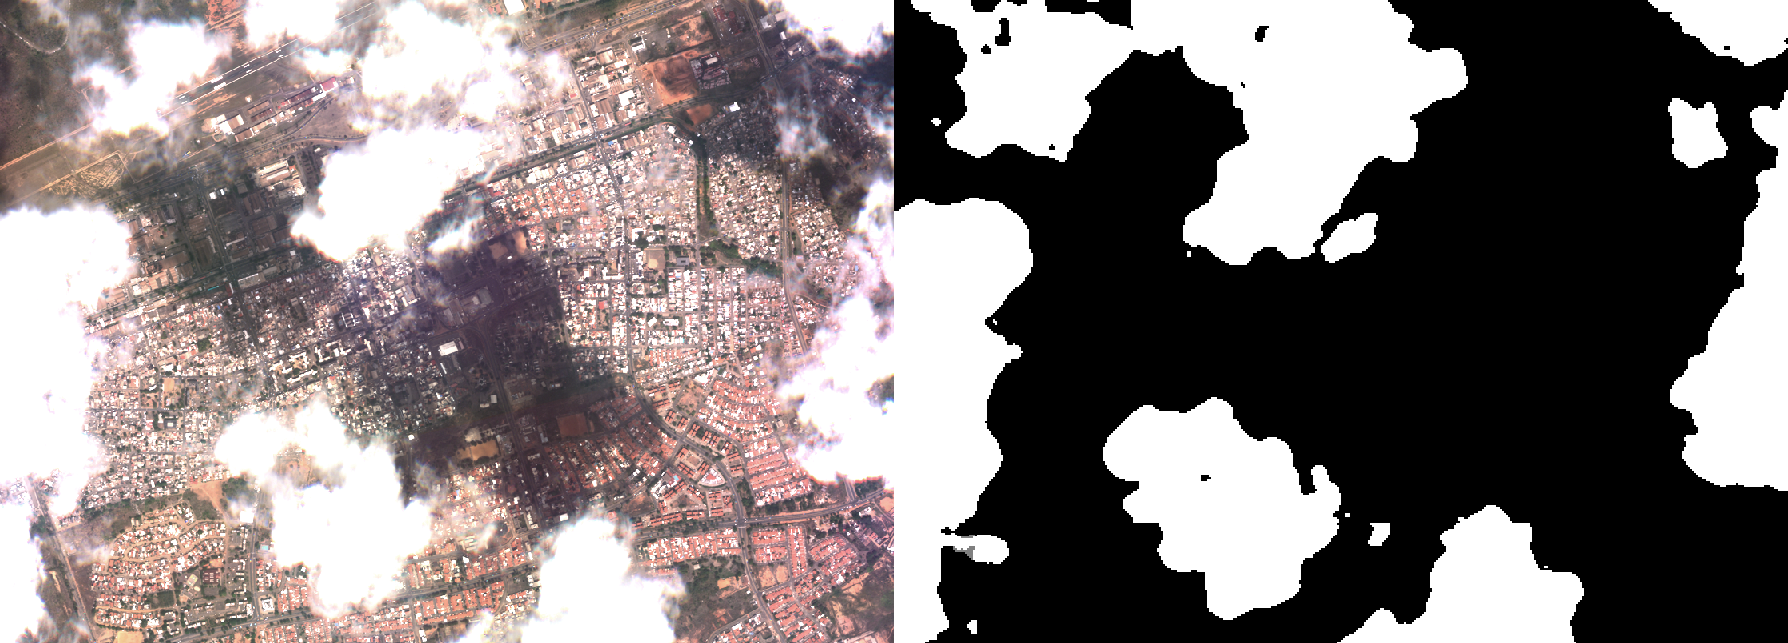
Cloud masks are provided as single band GeoTIFFs. Check here for details and how masks are computed for L1D product. For L2A, the cloud masks are inherited from the corresponding L1D product.
BOA metadata
The BOA metadata asset descibes the atmospheric parameters that were used to calculate the atmospheric correction for each item.
| Field Name | Description | Example |
|---|---|---|
| aerosol_model | 6S model used - currently continental only |
continental |
| aot_value | Aerosol optical depth at 550nm | 0.2 |
| aot_source | The source of the AOT value. Available: AERDB_L2_VIIRS_NOAA20 or AERDB_L2_VIIRS_SNPP or None |
AERDB_L2_VIIRS_NOAA20 |
| aot_status |
Text indicating the availability of AOT data.
|
data found |
| ozone_value | Ozone content ($cm-atm$) | 0.3025 |
| ozone_source | The source of the ozone value. VNP04ANC or VJ104ANC |
VJ104ANC |
| ozone_status |
Text indicating the availability of ozone concentration data.
|
data found |
| water_vapor_value | Water vapor content ($g/cm^2$) | 2.84 |
| water_vapor_source | The source of the water vapor value. VNP04ANC or VJ104ANC | VJ104ANC |
| water_vapor_status |
Text indicating the availability of water vapor concentration data.
|
data found |
| atmospheric_model | 6S atmospheric_model used water_vapor_and_ozone - this model is used when there’s ozone and water vapor concentration data available predefined - a predefined model is used based on the latitude and date of the capture. | water_vapor_and_ozone |
| satellite_azimuth | Viewing azimuth angle. The angle measured from the sub-satellite point (point on the ground below the platform) between the scene center and true north. Measured clockwise from north in degrees (0-360) | 229.0048668147364 |
| satellite_off_nadir | The angle from the sensor between nadir (straight down) and the scene center. Measured in degrees (0-90). In case this angle cannot be computed, a value of -1 will be reported | 13.961085570229528 |
| sun_azimuth | Sun azimuth angle. From the scene center point on the ground, this is the angle between truth north and the sun. Measured clockwise in degrees (0-360) | 222.70165259247 |
| sun_elevation | The estimated sun elevation measured at the target at the moment of the capture. Value in degrees. | 24.0 |
| latitude | The latitude of the target. | 33.55891099796737 |
Item metadata
| Prefix | Field Name | Description | Example |
|---|---|---|---|
| n/a | id | Unique identifier for the STAC item | 20250930_025801_143_SN45_L2A_MS_0_0_1 |
| n/a | bbox | Item bounding box | [ 119.56896495671906, 23.62805912936759, 119.65730868533569, 23.690097800133774 ], |
| n/a | geometry | Product footprint polygon or multi polygon | {
"type": "Polygon",
"coordinates": [
[
[-59.39745426956545,
-14.839874521738926],
[-59.397653769623574,
-14.857959361744172],
[-59.37906678933578,
-14.858152718581847],
[-59.37886883226247,
-14.840067632759192],
[-59.39745426956545,
-14.839874521738926]
]
]
}, |
| n/a | assets | List of the assets available for a given item | {
"preview": {
"href": "link to the file",
"type": "image/png",
"roles": [
"overview"
]
},
"cloud": {...},
"analytic": {...},
"BOA_metadata": {...}
} |
| n/a | collection | Collection name | l2a |
| properties | gsd | Ground sample distance in meters | 0.7 |
| properties | proj : shape | Dimension of image in pixels (Height x Width) | [2861, 2860] |
| properties | grid:code | Satellogic 2x2km grid code | SATL-2KM-21S_242_8356 |
| properties | instruments | Options are MS for multispectral and HS for hyperspectral | ms |
| properties | datetime | Capture time | 2025-09-06T18:43:23.402269+00:00 |
| properties | platform | Satellite name that acquired the imagery | newsat46 |
| properties | proj:epsg | EPSG code of the Coordinate Reference System in which the image coordinates are | 4326 |
| properties | view : azimuth | Viewing azimuth angle. The angle measured from the sub-satellite point (point on the ground below the platform) between the scene center and true north. Measured clockwise from north in degrees (0-360) | 166.1138 |
| properties | view : off_nadir | The angle from the sensor between nadir (straight down) and the scene center. Measured in degrees (0-90). In case this angle cannot be computed, a value of -1 will be reported | 24.9490 |
| properties | view : sun_azimuth | Sun azimuth angle. From the scene center point on the ground, this is the angle between truth north and the sun. Measured clockwise in degrees (0-360) | 72.3332 |
| properties | view : sun_elevation | The estimated sun elevation measured at the target at the moment of the capture. Value in degrees. | 60 |
| properties | satl : satellite_generation | Satellite generation category, mainly to differentiate between MarkIV and MarkV | MarkV |
| properties | satl : outcome_id | The UUID of the entire capture this individual frame is part of | ffbabb4f-3a97-45ec-bca3-0e4d56608c1c |
| properties | satl : valid_pixel | Percentage of pixels that are valid, from 0 to 100 | 100 |
| properties | satl : exposure_sec | Exposure time of capture in seconds | 0.002769 |
| properties | satl : product_name | The product name | L2A |
| properties | satl : last_modified | Timestamp when the product was last processed | 2025-09-30T04:30:38.122305+00:00 |
| properties | satl : transaction_id | Internal processing transaction identifier | l0-pipeline-cw5td |
| properties | satl : product_version | Product Version | 0.0.1 |
| properties | satl : software_version | Internal software version used to process the product | 0.0.1 |
| properties | satl : satellite_altitude | Satellite altitude in meters | 498240.1195991831 |
| properties | satl : ground_lock | Boolean value that indicates if the processor was capable to find gcps at the capture | true |
| properties | satl-qa : qa_software_version | Quality Control project SW version. Inherited from L1D. | 2.11.2 |
| properties | satl-qa : alignment_ce95_blue | The 95th percentile of the band-to-band alignment error between the green and blue bands is reported in meters, In case this metric cannot be computed, a value of -999 will be reported. Inherited from L1D. | -999 |
| properties | satl-qa : geoaccuracy_ce90 | The 90th percentile of the geoaccuracy error reported in meters, In case this metric cannot be computed, a value of -999 will be reported. Inherited from L1D. | -999 |
| properties | satl-qa : geoaccuracy_rmse | The root mean square error of the geoaccuracy error reported in meters, In case this metric cannot be computed, a value of -999 will be reported. Inherited from L1D. | -999 |
| properties | satl-qa : alignment_ce95_red | The 95th percentile of the band-to-band alignment error between the green and red bands is reported in meters, In case this metric cannot be computed, a value of -999 will be reported. Inherited from L1D. | -999 |
| properties | satl-insights : lulc_snow | Land use/land cover percentage for snow. Inherited from L1D. | 0 |
| properties | satl-insights : lulc_urban | Land use/land cover percentage for urban areas. Inherited from L1D. | 8.1 |
| properties | satl-insights : lulc_water | Land use/land cover percentage for water. Inherited from L1D. | 77.3 |
| properties | satl-insights : lulc_forest | Land use/land cover percentage for forest. Inherited from L1D. | 12.6 |
| properties | satl-insights : lulc_bareland | Land use/land cover percentage for bare land. Inherited from L1D. | 0.5 |
| properties | satl-insights : lulc_cropland | Land use/land cover percentage for cropland. Inherited from L1D. | 0 |
| properties | satl-insights : lulc_grassland | Land use/land cover percentage for grassland. Inherited from L1D. | 1.5 |
| n/a | tile_geometry | Tile bounding box | {
"type": "Polygon",
"coordinates": [
[
[-59.39745426956545,
-14.839874521738926],
[-59.39765383942619,
-14.857965685109374],
[-59.37906035733394,
-14.858159109401297],
[-59.37886233153779,
-14.8400677000418],
[-59.39745426956545,
-14.839874521738926]
]
]
}, |
Packaging specification
TBD
Changelog
| L2A Software Version | Release date | Change log |
|---|---|---|
| 0.1.0 | 17/02/2026 |
|