Sharpness
Image sharpness is one of the most important image quality characteristics. It evaluates image blur which limits the visibility of fine details. Image blur is introduced by both the optical system and potential motion during the exposure.
Our sharpness assessment method calculates Full Width Half Maximum (FWHM) values along and across track using a blur kernel estimator. This methodology is still under development.
Background
Assuming the blur kernel (or point spread function, PSF) \(k\) which combines the optical and motion blur, the following model relates the latent sharp image \(u\) with the image \(v\) acquired by the optical system: $$ v = u * k + n, $$ where \(n\) is the acquisition noise. Given a working image \(v\) our objective here is to find \(k\). Notice this is an ill-posed problem, because both \(u\) and \(k\) are unknown and, in general, there is not a unique solution. Pan et al., 20131 developed a method which is based on the \(\ell0\) gradient prior which restores the main structures of the image, including dominant edges. Once the edges are restored, the blur kernel can be estimated. The method iterates between the estimation of the sharp image using the previous kernel and the re-estimation of the blur kernel.
In our method presented in the following section we use the open-source implementation of Anger et al., 20192. While the original kernel estimation method was designed for text and natural images, Anger et. al. 20193 has demonstrated its utility for sharpness assessment of satellite imagery.
Algorithm implementation
We use the blur kernel estimation method as the core of a multi-step pipeline. We handle each band at each image processing level independently, and we work with a grayscale (1 channel) array throughout the pipeline. The algorithm essentially divides the image into windows, selects a subset of the best windows, computes the blur kernels in such a set from which its derives each FWHM and eventually it aggregates the results. Because we work with each band separately, we provide a sharpness measurment for each band of each processing level.
The following provides more details of each step of the algorithm:
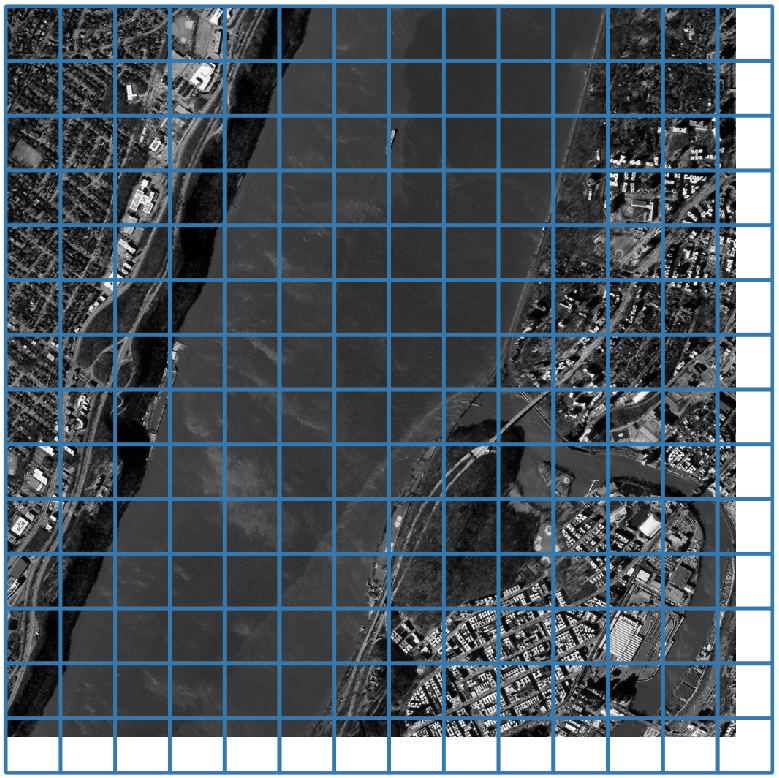
Image division
The image is divided in windows (sub-images) of size \(w \times w\) pixels, where \(w\) is currently fixed to 256.
Feature extraction and window ranking
For each window, a set of statistics are computed, including but not limited to:
- dynamic range;
- ratio of valid pixels, where invalid pixels are the nodata pixels, cloudy, or saturated pixels;
- statistics from an edge detection algorithm.
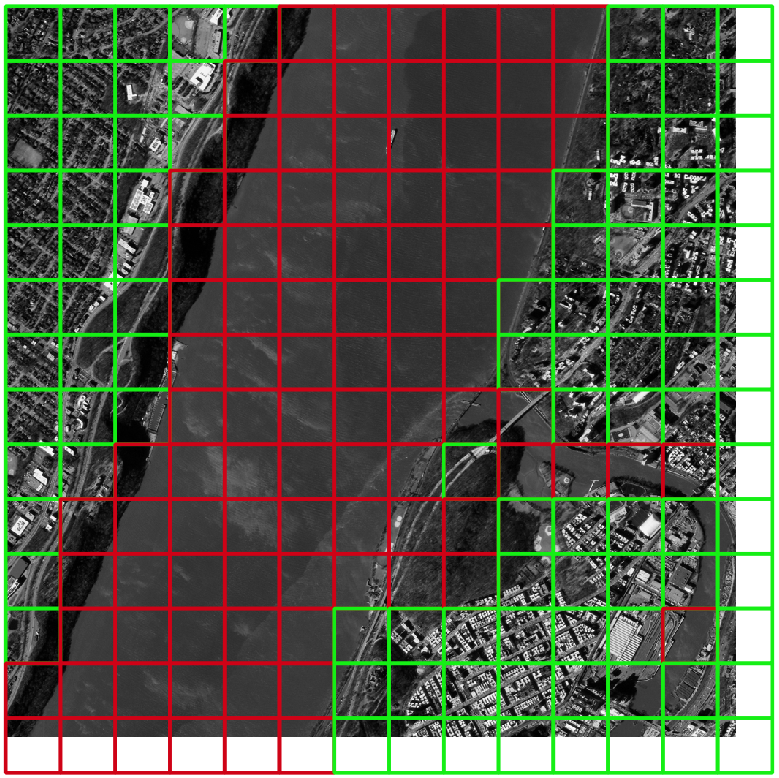
The purpose of calculating these values is to find the best possible windows to run the kernel estimation algorithm. We use thresholds on these statistics to discard unsuitable windows. A window might be unsuitable for multiple reasons, such as being too cloudy, or too featureless for sharpness assessment, like images of water bodies, deserts, dense vegetation, etc. At the moment we do not have any land cover information of the images during the sharpness assessment pipeline, so we rely on these image statistics and thresholds.
As we use the sharpness metric in more and more images, we are able to refine the thresholds and obtain more robust results.
The windows that pass the filtering thresholds are also ranked based on the statistics, where highly ranked windows are most feature-rich ones.
Window selection
From the windows that passed the previous step the best 5 windows are selected. If less than 5 windows passed the filtering process, we require at least 3, otherwise the result is that the image is not suitable for sharpness assessment, and value of \(-999\) is set as FWHM.
Kernel estimation
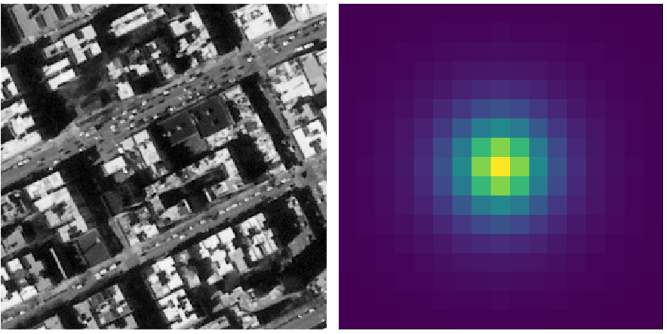
For each of the selected windows we run the blur kernel estimation method (see Background section above). The main parameters of this algorithm are: the number of iterations \(p_{n_{iter}}\), the size of the kernel \(p_{kernel_{size}}\) in pixels, and the regularization weight \(\gamma\).
FWHM calculation
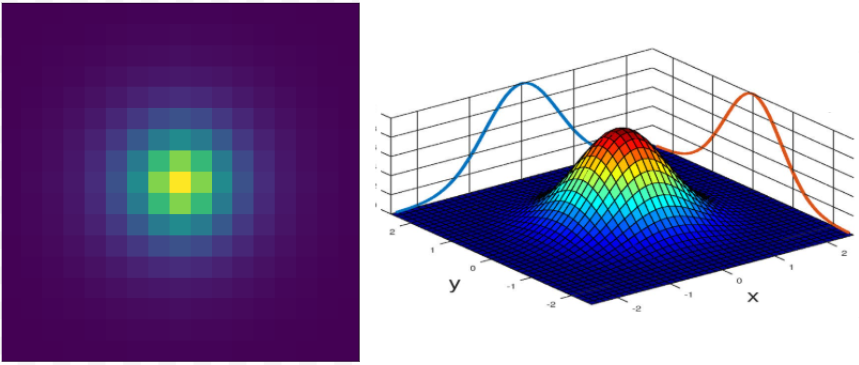
For each of the selected windows the obtained blur kernel is modeled as a 2D gaussian function using a non-linear least squares approach. In particular, the dispersion values along its main axis \({\sigma}_{x}\), \({\sigma}_{y}\) are estimated. From the \({\sigma}\) we calculate the FWHM in the row- and column-wise direction of the images.
Aggregation
The results of the the windows are then aggregated in each direction, to obtain the FWHM of the image in the given orientation and band.
Calibration
There are standard methods to evaluate image sharpness such as the slanted edge method, which is mostly used on targets specifically built for sharpness measurements. We used the slanted edge method and the Baotou calibration target to evaluate and calibrate our method.
During the initial evaluation we found that while our method gives reasonable results, it doesn't fully reproduce the values obtained with the slanted edge method. Therefore we used the slanted edge method measurements as "ground thruth" to find the best combination of kernel estimation parameteres (see Step 5) and a linear transformation that leads to the best agreement between our method and the ground truth.
The best parameter combination then was tested in an independent set of images. The result is shown in the figure below.
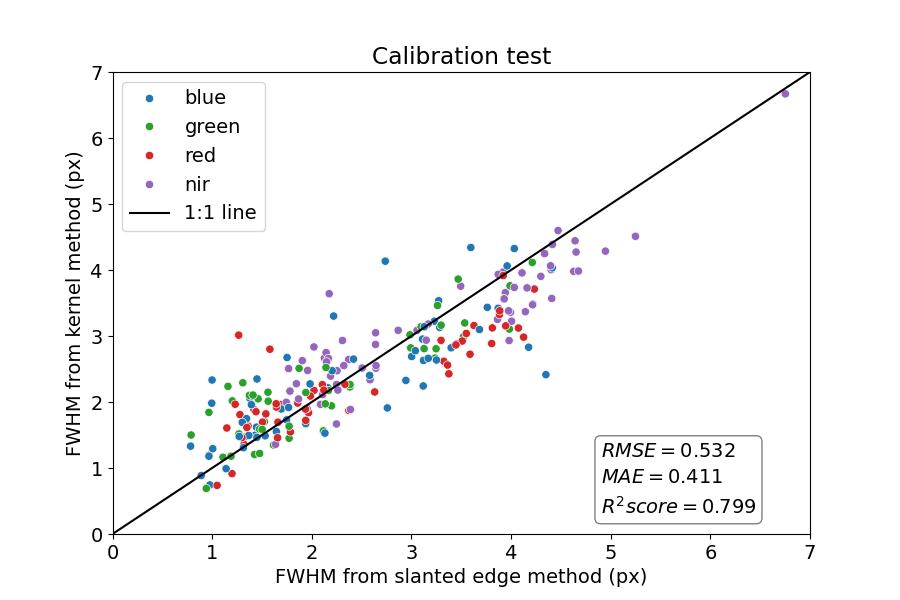
At the moment, calibration was carried out for L1D and L1D-SR levels only. In L0, L1A, L1C levels we use the calibration parameters obtained for L1D.
Changelog
| QA Software Version | Release date | Change log |
|---|---|---|
| 2.13.0 | 02-12-2025 |
|
| 2.11.1 | 30-07-2025 |
|
Caution: Experimental Metric
This metric is currently experimental. Its values are preliminary and require further characterization. Use with discretion.
-
Jinshan Pan Zhixun Su (2013), “Fast \(\ell0\)-Regularized Kernel Estimation for Robust Motion Deblurring“, IEEE Signal Processing Letters, 20 (2013), pp. 841–844. https://doi.org/10.1109/LSP.2013.2261986. ↩
-
J. Anger, G. Facciolo, and M. Delbracio, “Blind image deblurring using the l0 gradient prior,” Image Processing On Line, 9 (2019), pp. 124–142. https://doi.org/10.5201/ipol.2019.243 ↩
-
Anger, J., de Franchis, C. & Facciolo, G. “Assessing the sharpness of satellite images: study of the planetscope constellation.“ In Proc. IGARSS 2019—2019 IEEE International Geoscience and Remote Sensing Symposium 389–392 (IEEE, 2019); https://doi.org/10.1109/IGARSS.2019.8900526 ↩