Multispectral payload
Payload design
Mark IV and V satellites have multispectral payloads with a camera system which captures images of approximately 1m GSD and a swath width of 5 km and 0.7m and 6.7Km respectively, covering the wavelength ranges between 450 nm and 900 nm (check Spectral response). The system uses a closed-loop real-time stabilization system to compensante earth movement and reduce blur. In front of the sensor, there is a 4 band filter that allows to capture the four spectral bands.
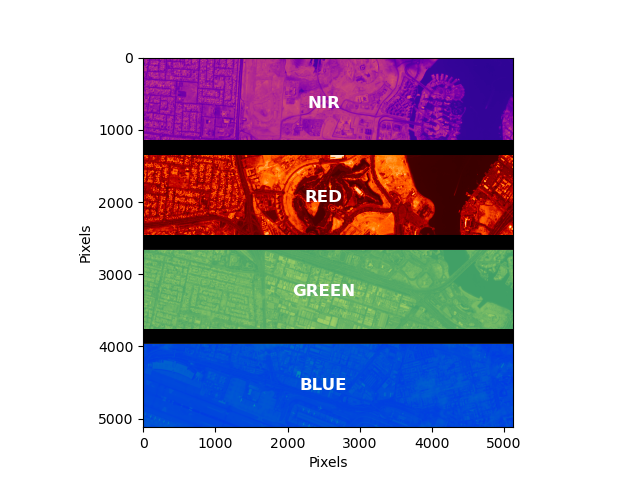
All products are made from raw frames like the following image.
| Mark IV | Mark V |
|---|---|
 |
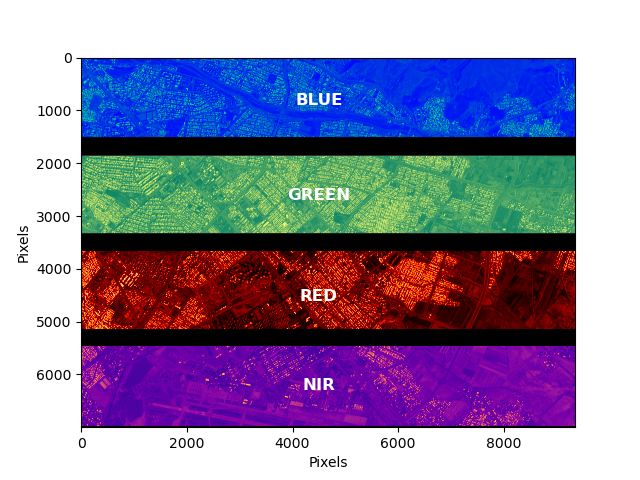 |
By capturing consecutive frames the acquisition system is capable of mapping the information in the four spectral bands.
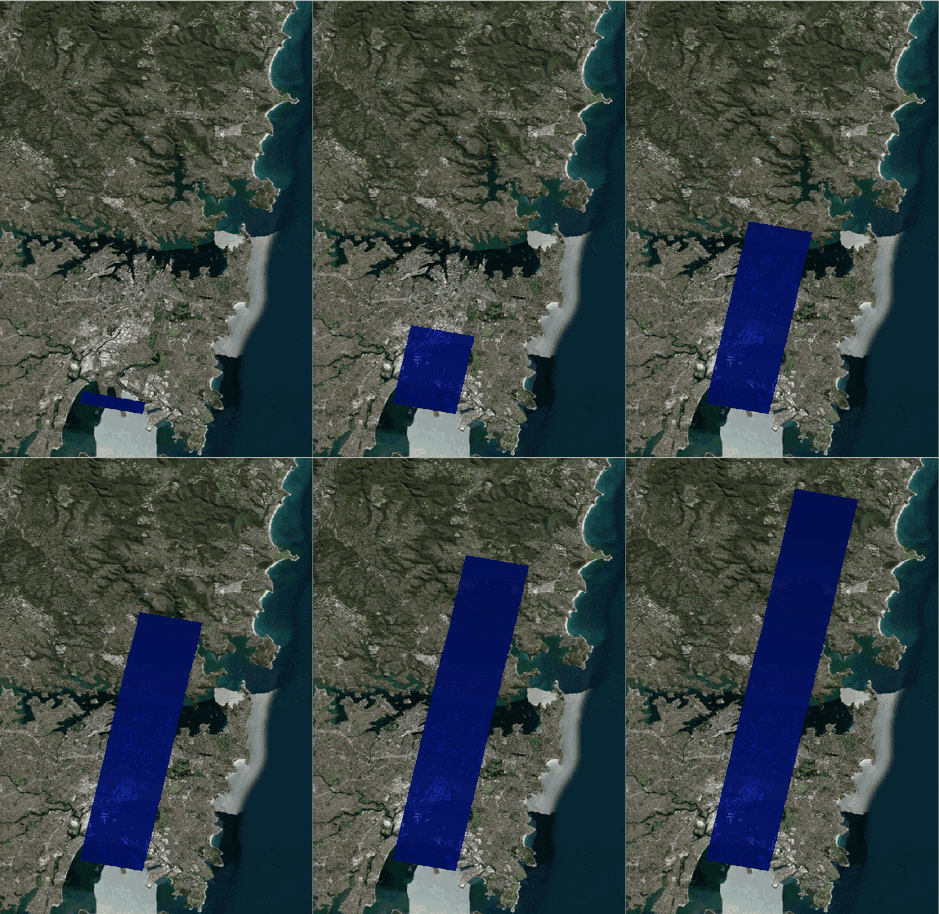
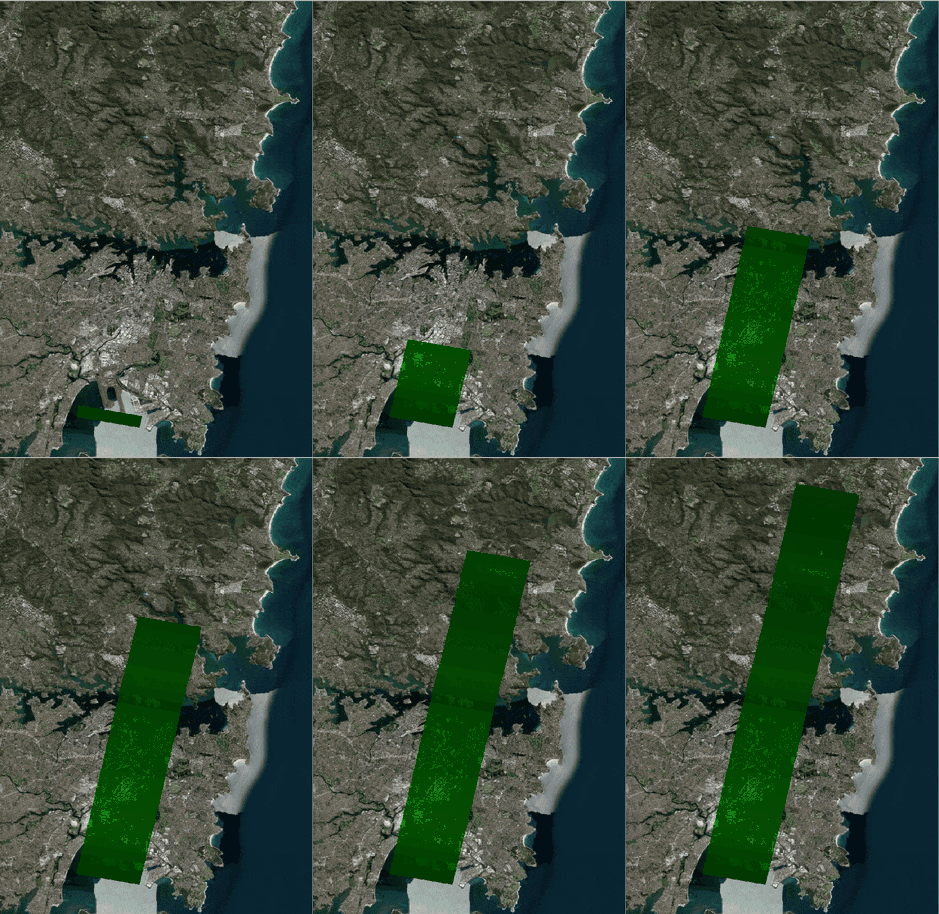
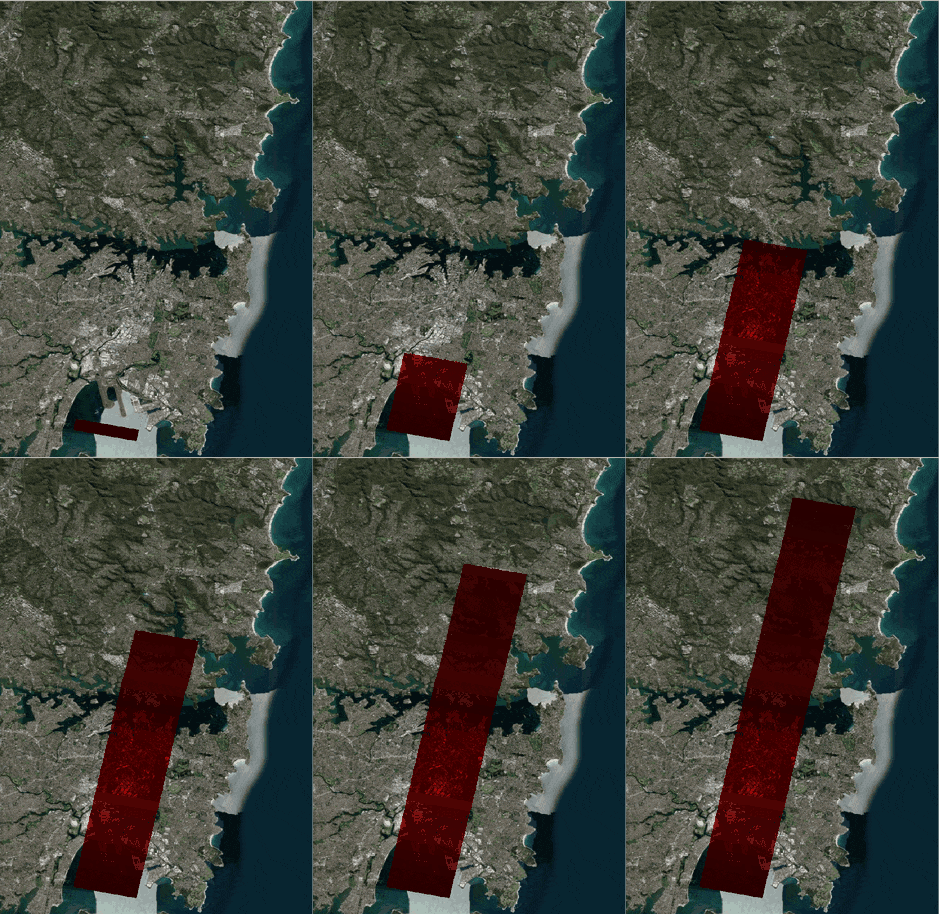
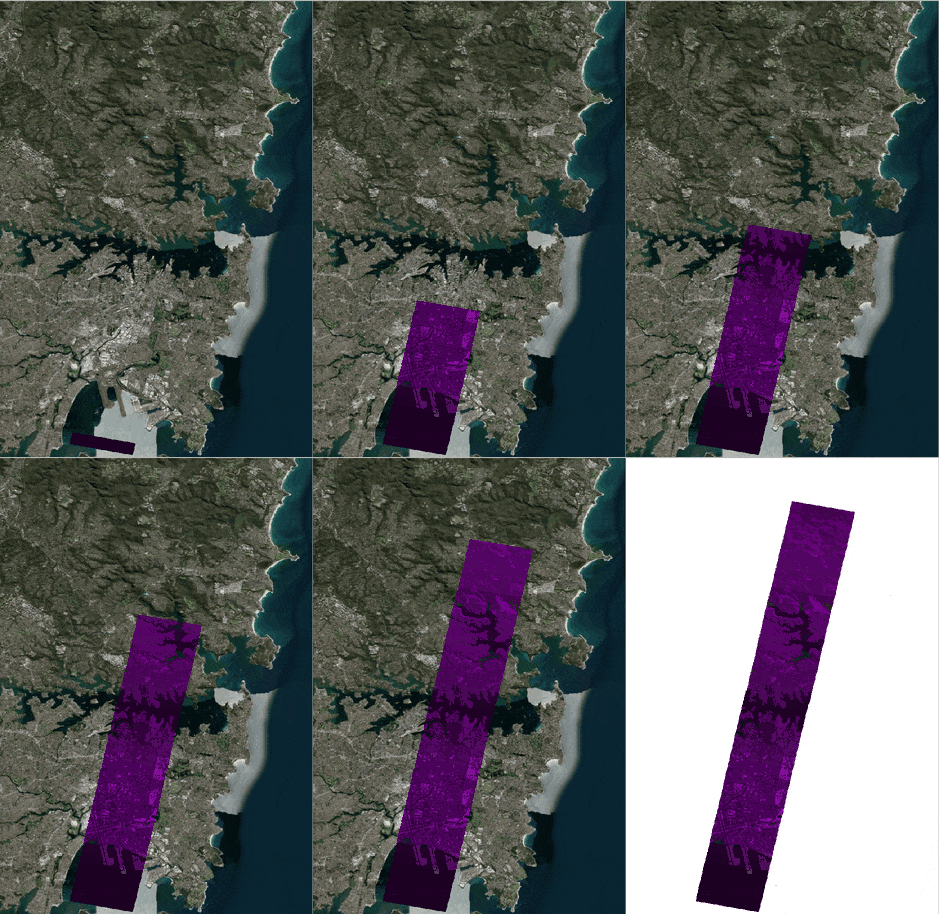 Blue, Green, Red and NIR coverage.
Spectral Response
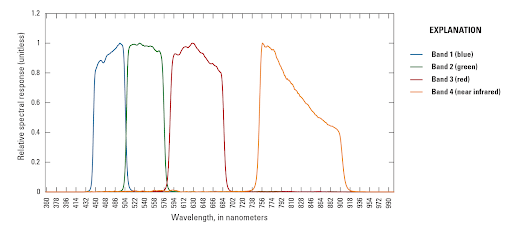
Imagery are captured in visible and near-infrared bands (Red, Green, Blue and NIR), with each band covering a wide range of wavelength to maximize object characterization.
- Blue: 450 - 510 nm
- Green: 510 - 580 nm
- Red: 590 - 690 nm
- Near-IR: 750 - 900 nm
The following archive contains the spectral response functions of every satellite in our active fleet: newsat_srfs.zip. Alternatively, you can find SRFs individually for each platform below in a csv format:
- newsat6
- newsat7
- newsat8
- newsat9
- newsat10
- newsat11
- newsat12
- newsat13
- newsat14
- newsat15
- newsat16
- newsat17
- newsat18
- newsat19
- newsat20
- newsat21
- newsat22
- newsat23
- newsat24
- newsat25
- newsat26
- newsat27
- newsat28
- newsat29
- newsat30
- newsat31
- newsat32
- newsat33
- newsat34
- newsat36
- newsat37
- newsat40
- newsat41
- newsat43
- newsat44
- newsat45
- newsat46
- newsat48
- newsat49
- newsat50
Spatial Resolution
Satellogic's multispectral imagery products have a very high spatial resolution natively across all spectral bands. Images are captured with approximately 1m native resolution at nadir for all spectral bands. Basic products are resampled for consistency to 1m GSD. Satellogic applies proprietary algorithms to enhance images to 70cm GSD on all bands providing considerable advantages in terms of pixel-level radiometry.
Radiometric Calibration
Satellogic imagery’s radiometric accuracy is attained through a combination of lab measurements and on-orbit vicarious calibrations. Satellogic performs on orbit calibration based on processing data retrieved from crossovers with a well calibrated source (Sentinel-2). This allows the continuous tracking of radiometric stability and the improvement of the calibration in case it is needed. The main targets used for vicarious campaigns are Railroad Valley Playa (USA), Gobabeb (Namibia), Baotou Sand (China) and La Crau (France) calibration sites, where the radiometric accuracy of Satellogic’s L1 products was evaluated as \(15 \%\).
By using calibration data retrieved from these two methods, raw data values as collected by the sensor (DNs) are converted to Top of Atmosphere (TOA) Reflectance to produce images that are free from sensor and top of atmosphere distortions.
Known Limitations
The four filter bands of the sensor form four stripes stacked along-track. This means that the four bands of a scene are imaged at different times and from slightly different satellite positions. This configuration results in certain incorrigible features on the images. The most common and best known limitations are listed in this section.
Moving objects
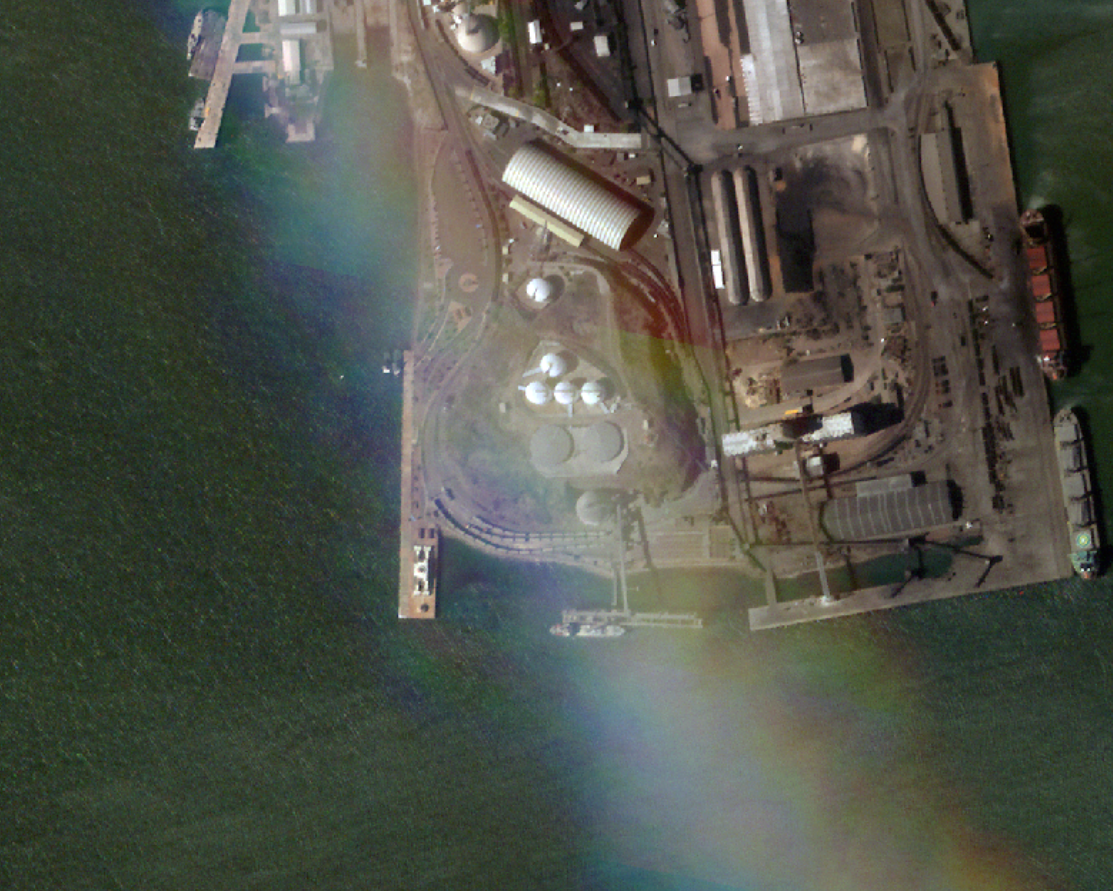
Moving objects, such as vehicles on the ground or in the sea, appear at different positions in different color bands. This feature can be used to determine the object velocity.

High altitude objects
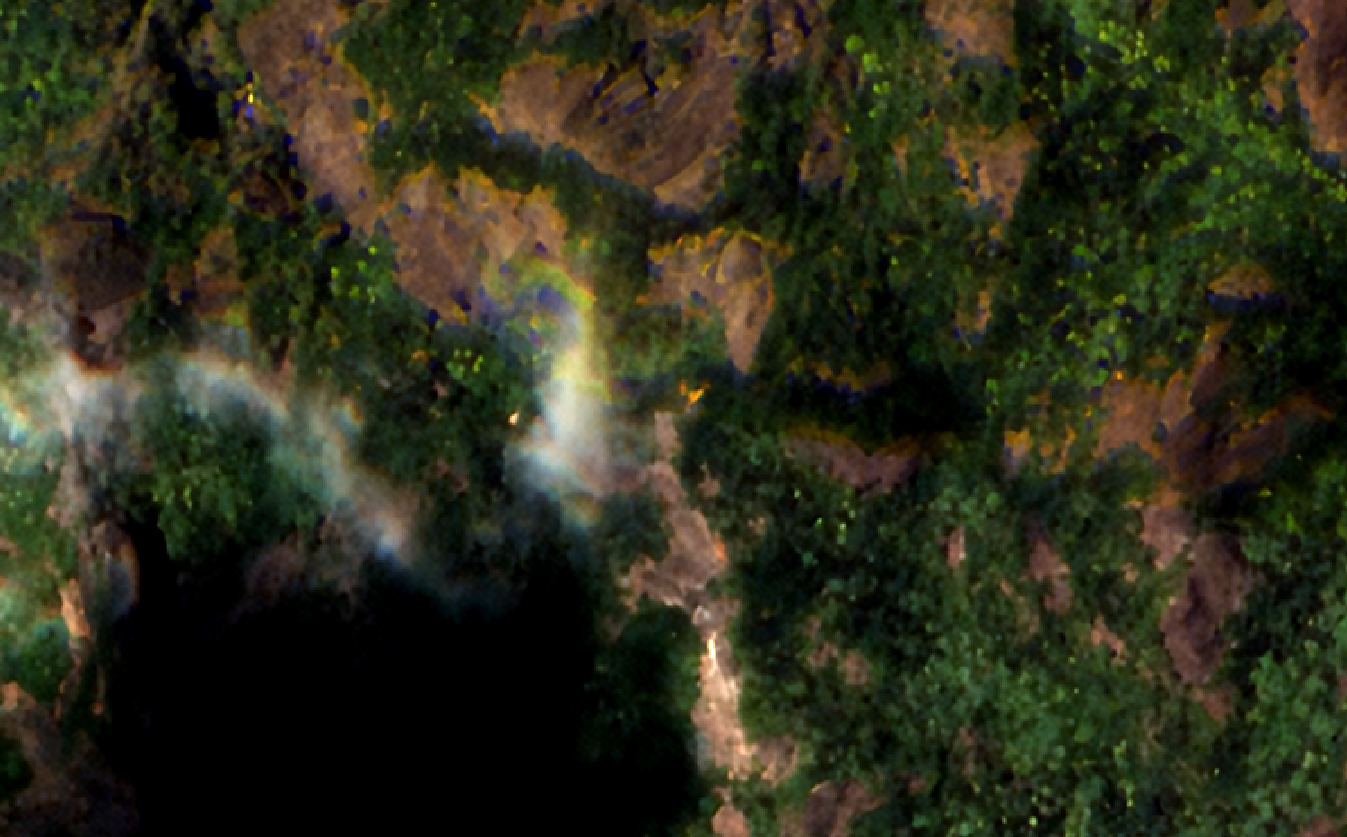
Similarly to moving objects, high altitude objects, such as clouds, haze and airplanes, appear at different positions in different color bands, usually due to a parallax effect, which may combine with the object movement.

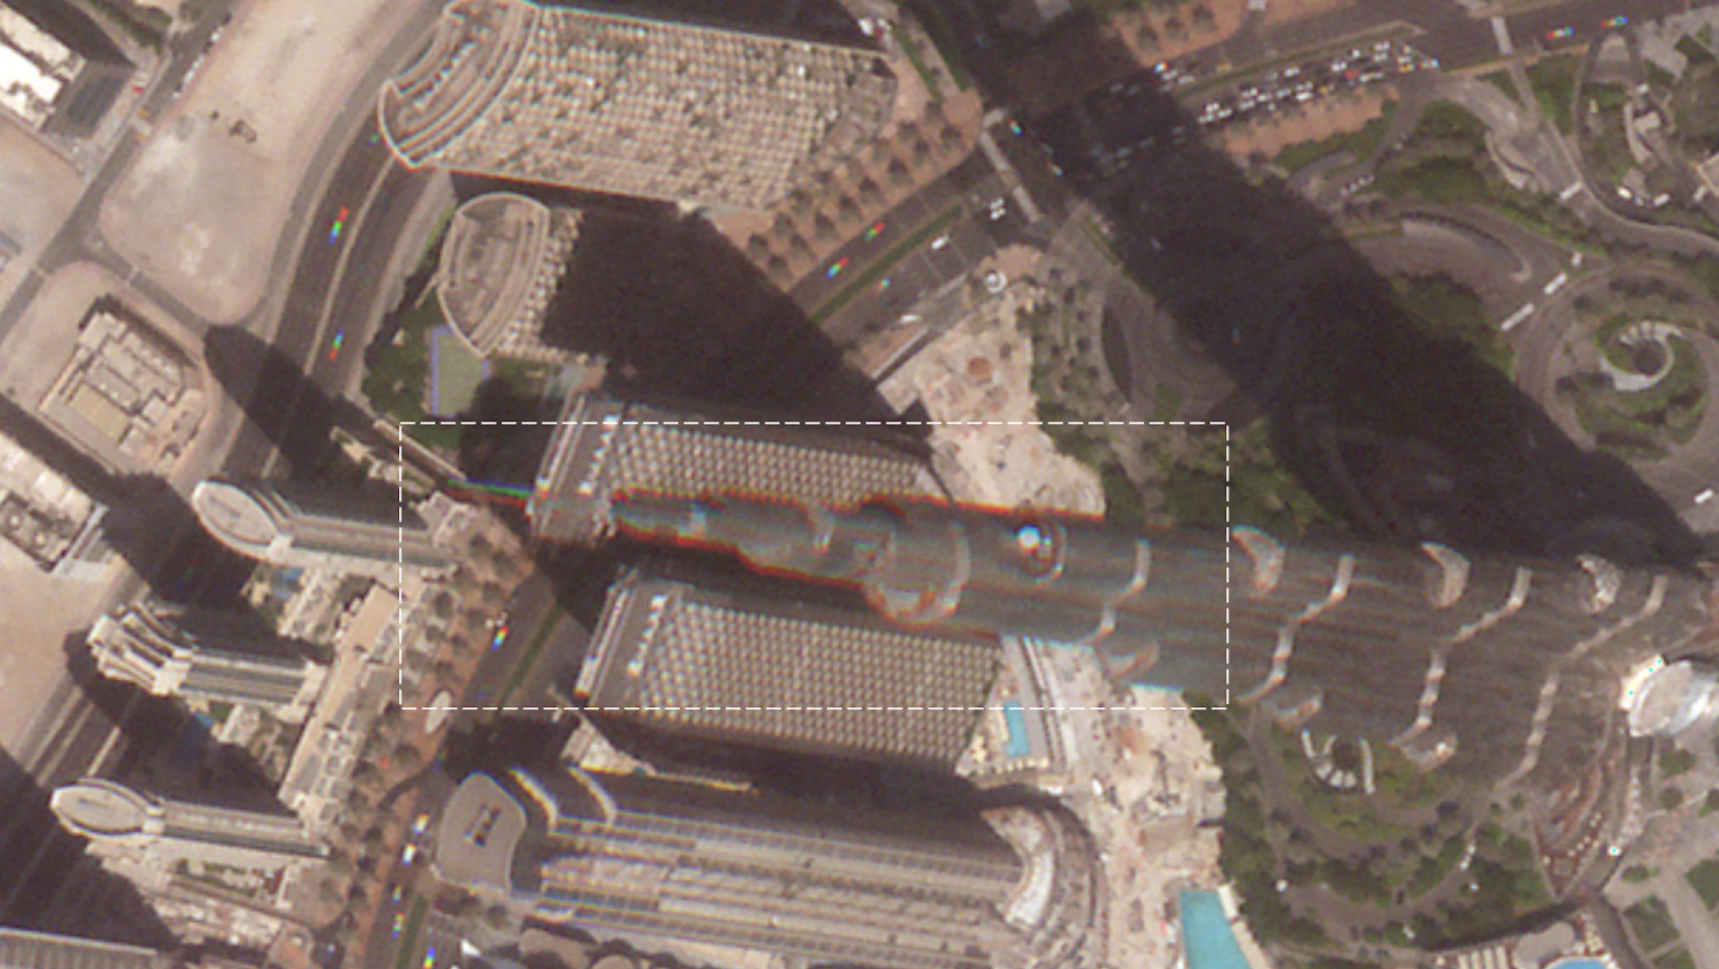
Because of the parallax effect, the tip of very high buildings can also appear at different positions in different bands, as it can be seen in the following image.
Parasitic light sensitivity
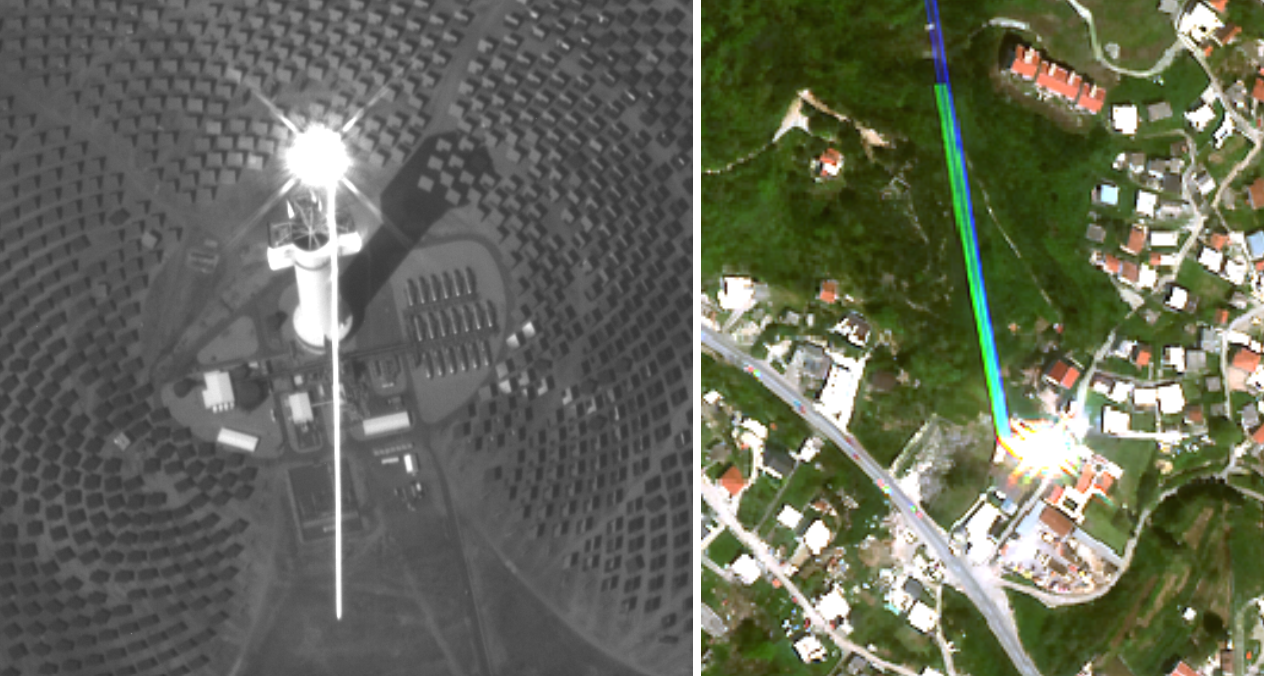
Many digital sensors are sensitive to light even outside the exposure time. The sensor is said to be sensitive to parasitic light. This sensitivity is much lower than the sensor sensitivity during the exposure, but not negligible. If a high reflectance object is captured, causing saturation at its position during the exposure time, there will be additional photoelectrons generated while waiting for the readout. In the case of Newsat Mark-IV satellites, during the readout time the satellite has moved, causing a track of saturated pixels on the image, like the ones shown in the following images.
Ground level band misalignment
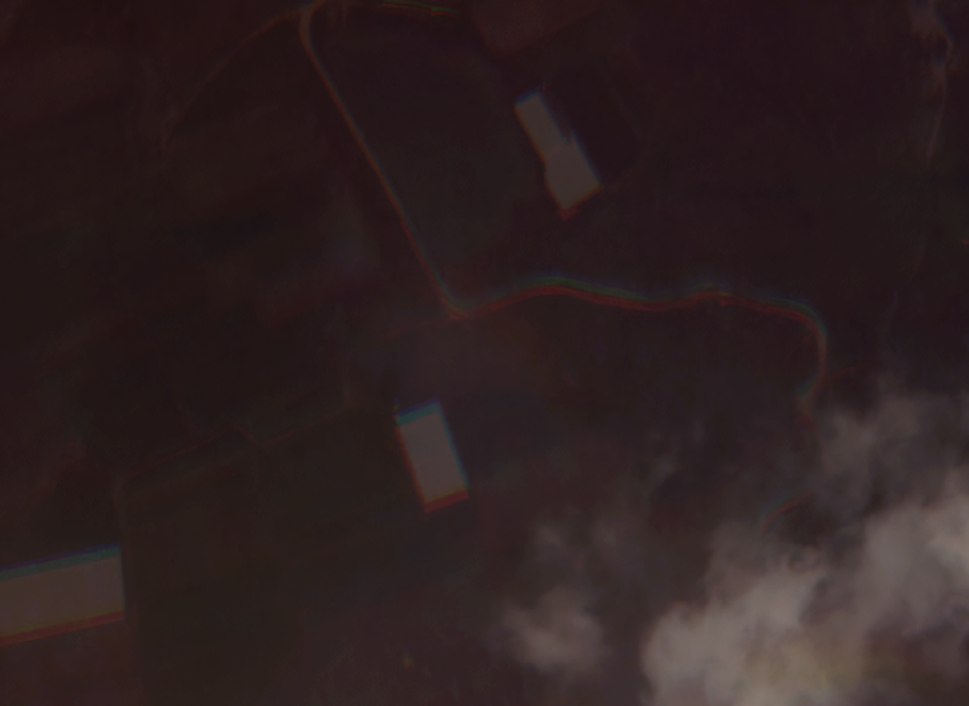
The design of the payload implies that band alignment is height specific. Normally, the geometric corrections optimize alignment at ground level, which implies band misalignment for high altitude objects. However, inaccurate geometric corrections can sometimes cause misalignment at the ground level.
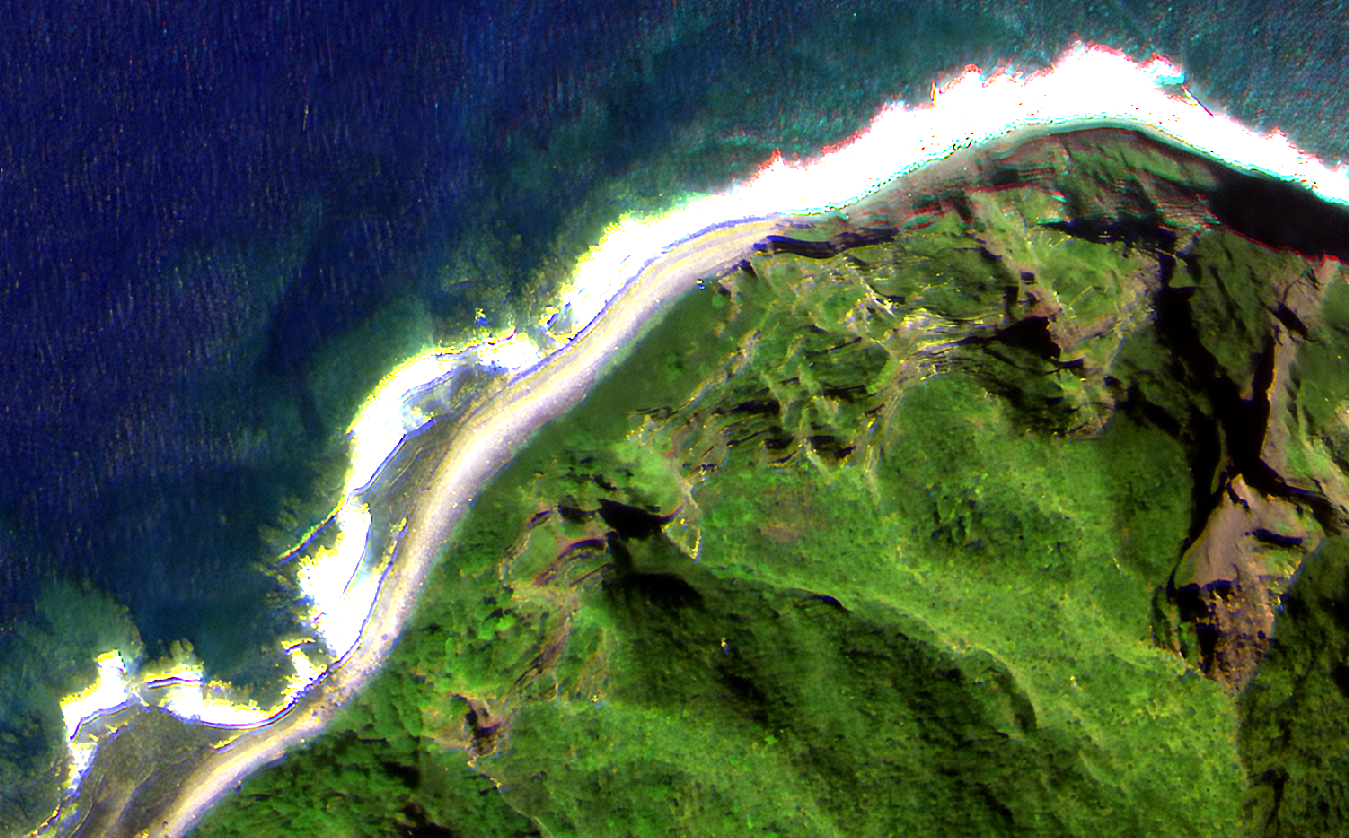
Such inaccuracies tend to appear in dark or featureless regions, where the algorithm cannot find sufficient matches to ground features. In particular, the presence of nearby clouds and haze can trigger this anomaly, because matching of points on clouds may push some correction algorithms towards better alignment at cloud-height at the expense of ground-level alignment .
Low signal-to-noise ratio
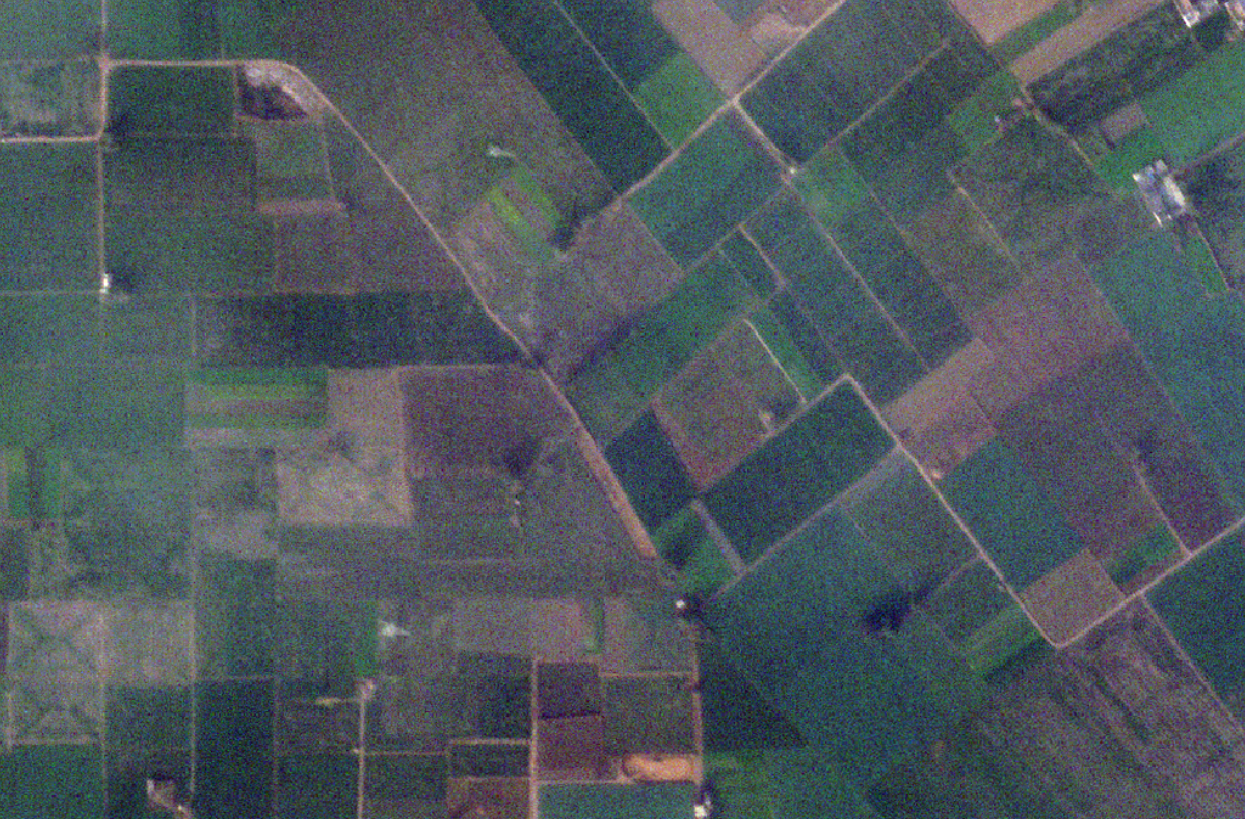
Some captures may have low signal-to-noise ratio and appear noisy. This can occur in targets with intrinsically low reflectance values and in shaded areas of low sun-elevation captures. Sometimes the exposure time may not be optimized for the entire capture.
Sensor defective pixels
A few sensors present some grouped dead pixels (appearing as low gain pixels in the flat-field frame) which usually cannot be fully corrected by the flat-field frame, but they may be mitigated or smoothed in the L1 composite, depending on the size of the dead pixel aggregation. Usually they are so small that they appear corrected in the L1 images. However, there might be some additional noise in and around these dead pixels in the L1 composite Additionally, depending on their position in the filter band (e.g. at the edge of the band), they may fall below the overlapping consecutive frame and thus not used in the L1 composite. A list of uncorrectable defective pixels will be provided in a future version of this document.

Inhomogeneous tonal distortion along the track
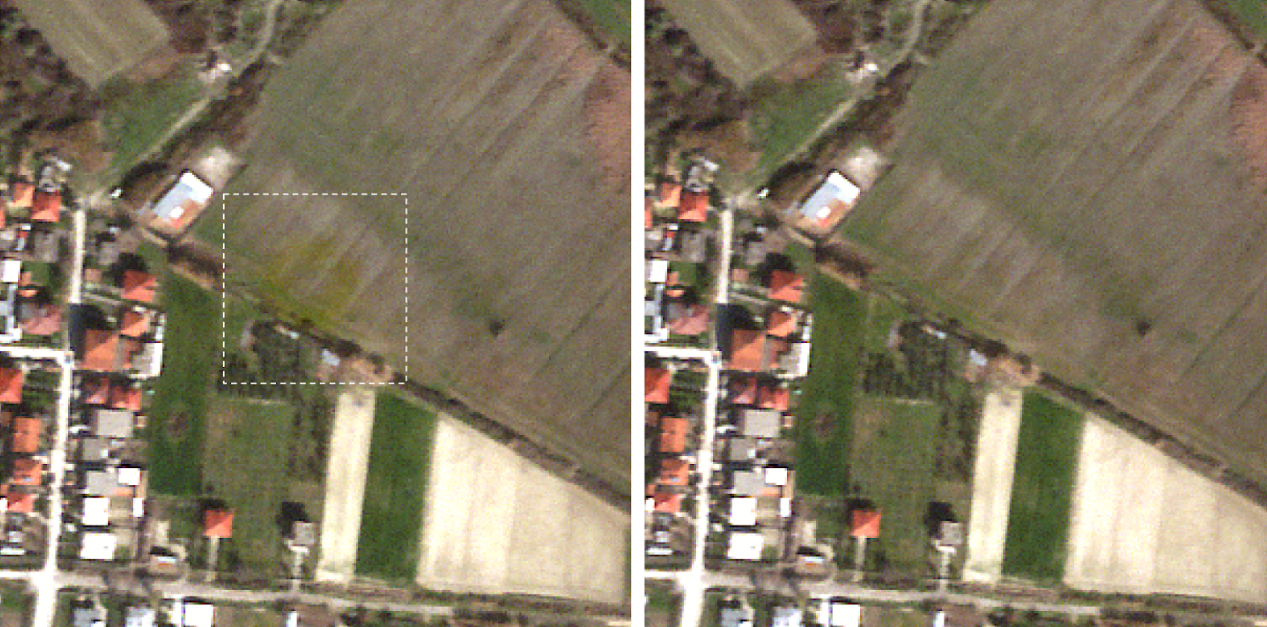
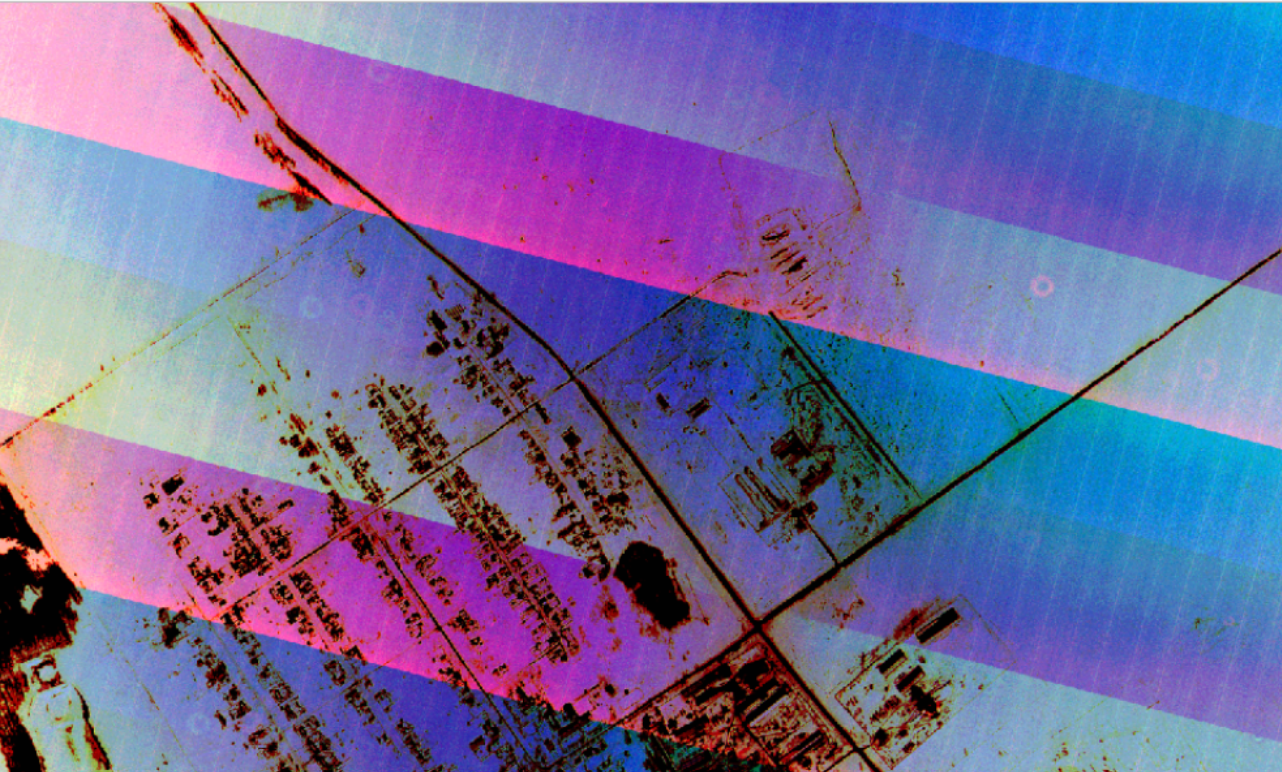
An outdated flat-field frame can infer tonal distortions in the tile center. In the stripe, this is usually noticeable along the track. In a RGB composite, a color artifact will appear. This occurs very rarely (roughly about 2 events per year for the entire fleet), as the flat-field frame is computed frequently (bi-weekly or monthly). This artifact can be corrected by post-processing with an updated flat-field. An example is provided below.

Blurred images
Although rarely, some captures may present blur. This effect can be caused on limited occasions by anomalies on the thermal conditions, by an unexpected behavior of the stabilization system or by an anomaly on the automatic refocusing system. This issue is uncorrectable.

Filter artifacts
Sometimes new dust particles appear on the filter. They usually affect small portions of a capture, acting like a light blocker. These artifacts can be corrected by re-processing the raw frames with a new flat-field frame. To reduce the occurrence of these artifacts in the imagery, the flat-field frames are periodically recomputed for each satellite, usually every 2–4 weeks. The following images show how these artifacts commonly appear in a single-band image and in a RGB composite.
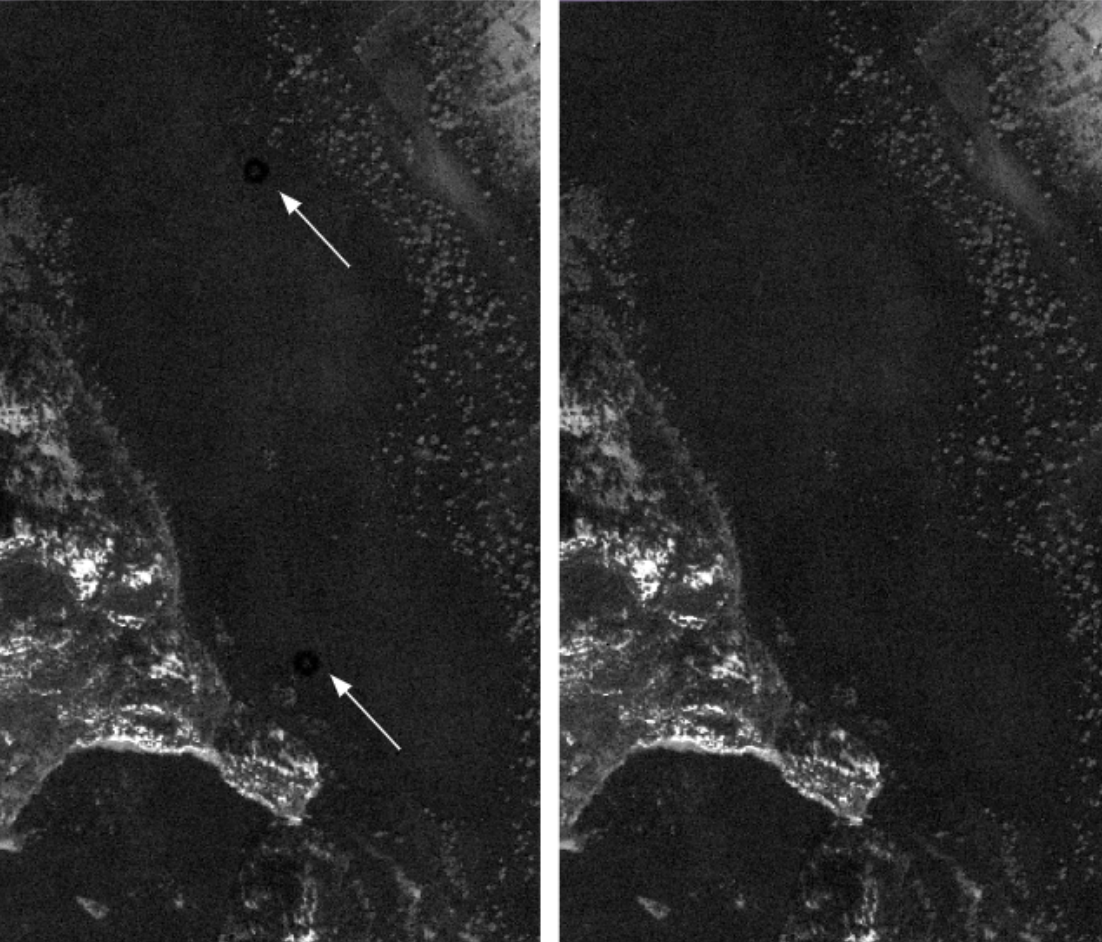
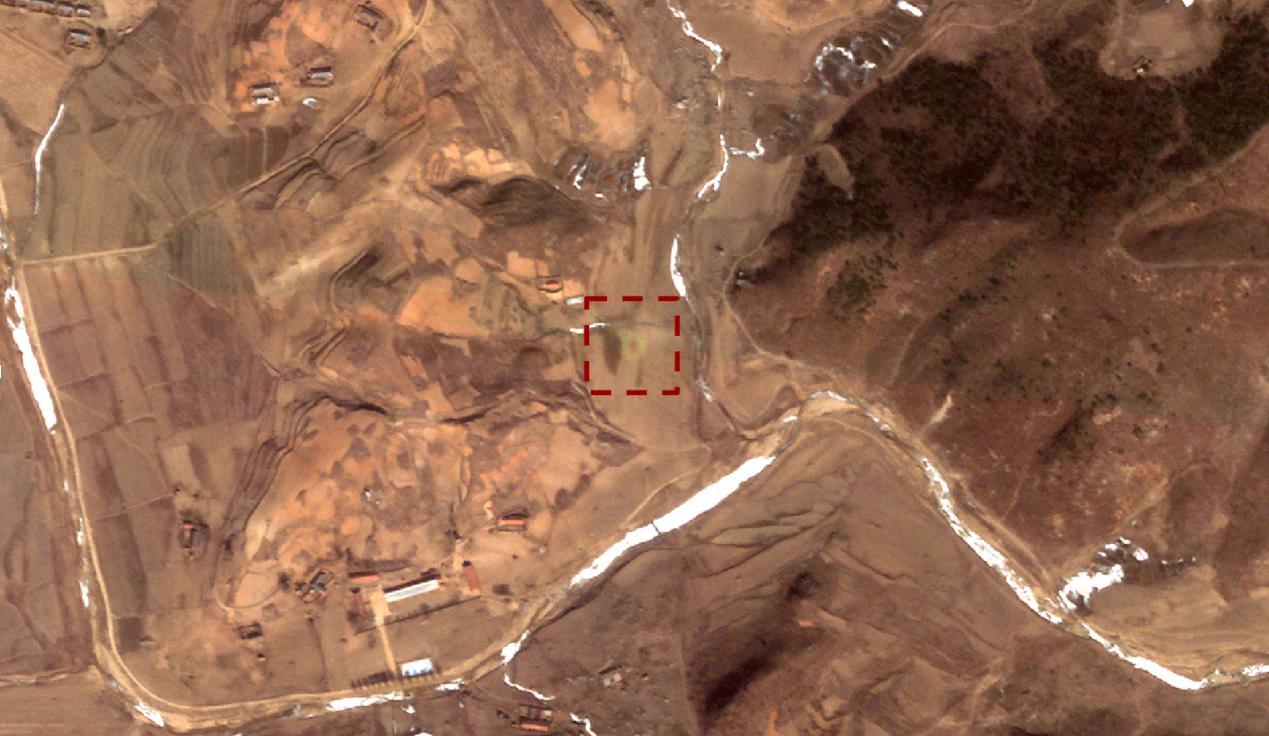
Although rarely, foreign object debris can create some superficial, small damage to the filter, allowing unfiltered light to reach the corresponding pixels on the sensor. This implies that the spectral information is lost in the affected areas. The resulting artifacts (usually bright donut-like shapes) are incorrigible with further processing
This artifact may not be present depending on the spectral signature of the target. The filter defects causing these artifacts are known and will be listed in a future edition of this document (including affected satellites and positions in the raw frame).
Payload artifacts in saturated images
In the areas of frames with very high reflectance values, such as bright clouds or snow, the raw frame value can saturate. The flat-field (gain) correction cannot work because of non-linearity in these saturated areas. As a consequence the final products most likely present payload artifacts, such as sensor defects, pixel response non-uniformity (PRNU) and undesired dust particles on the filter, and processing artifacts such as color bands. In the future, the pixels affected by saturation will be masked.
Color artifacts due to image compositing
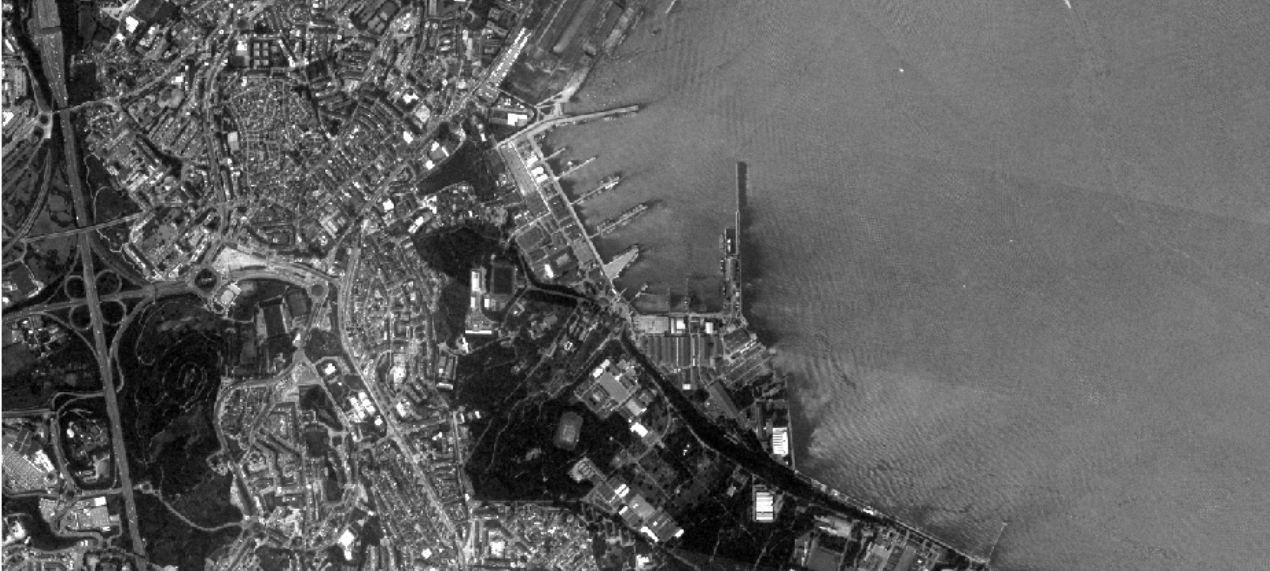
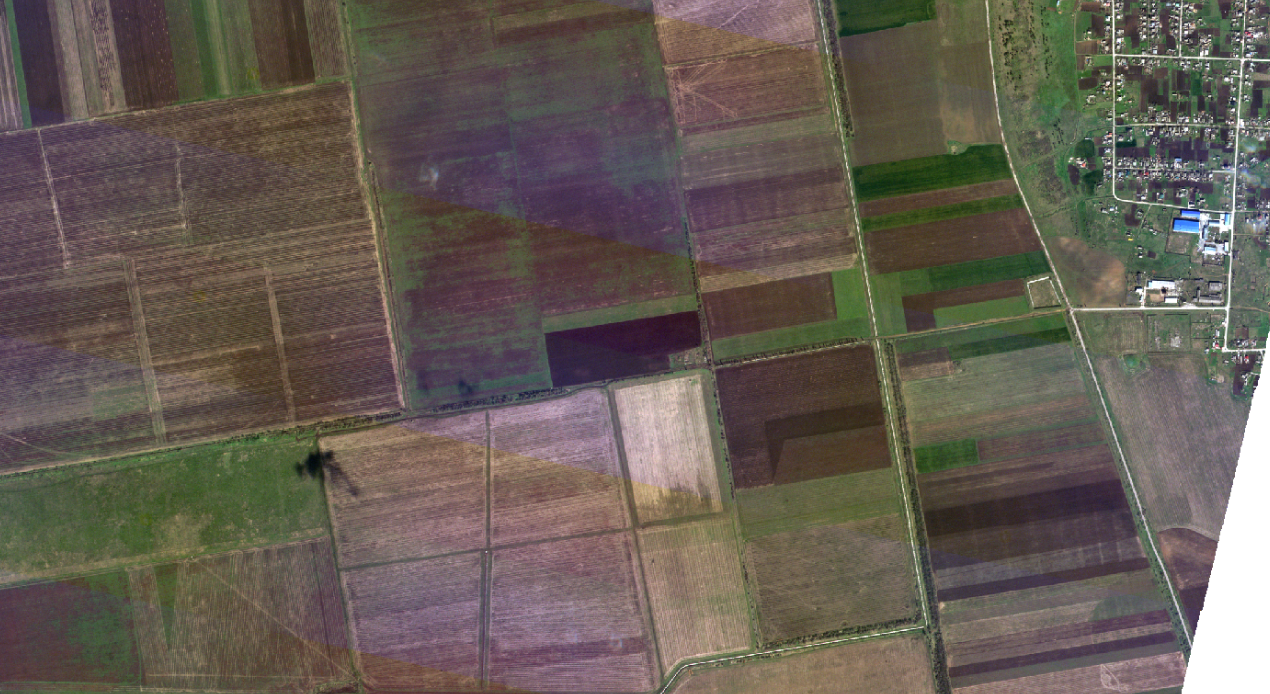
Some images can show sharp intensity change between two adjacent frames during image composition (Note: the composition process concerns only products: L1B basic, L1C, L1D/L1D_SR). This usually corresponds to a difference of 3% or less between the mean brightness levels of the frames in the overlapping pixels. In flat and homogeneous targets, such as water surfaces, deserts and snow, as well as in clouds, this can appear visually noticeable.
The following image shows an example of an uncorrected image composition artifact in an RGB composite.
Spectral Bands Misalignment
Cloudy images or images with moving objects such as waves may exhibit misalignment effects due to the incorrect alignment of the spectral bands.
Each of our spectral bands is collected at slightly different moments in time and from slightly different positions (separated by seconds and by a small angle difference), then combined into a single multiband image. For static and flat features at sea level, like low-rise buildings and roads, this has no effect on the visualization since there was no change between the different band acquisitions. However a rainbow effect might be seen in the following scenarios:
- Moving objects like, cars, planes, and even clouds
- Objects that are at high altitude with respect to background scenery
- Objects that have a significant vertical extent, such as tall buildings
In these scenarios you might see the object in each of the different bands slightly misaligned since it moved between band acquisitions, for example. This is an expected behavior in the imagery.
